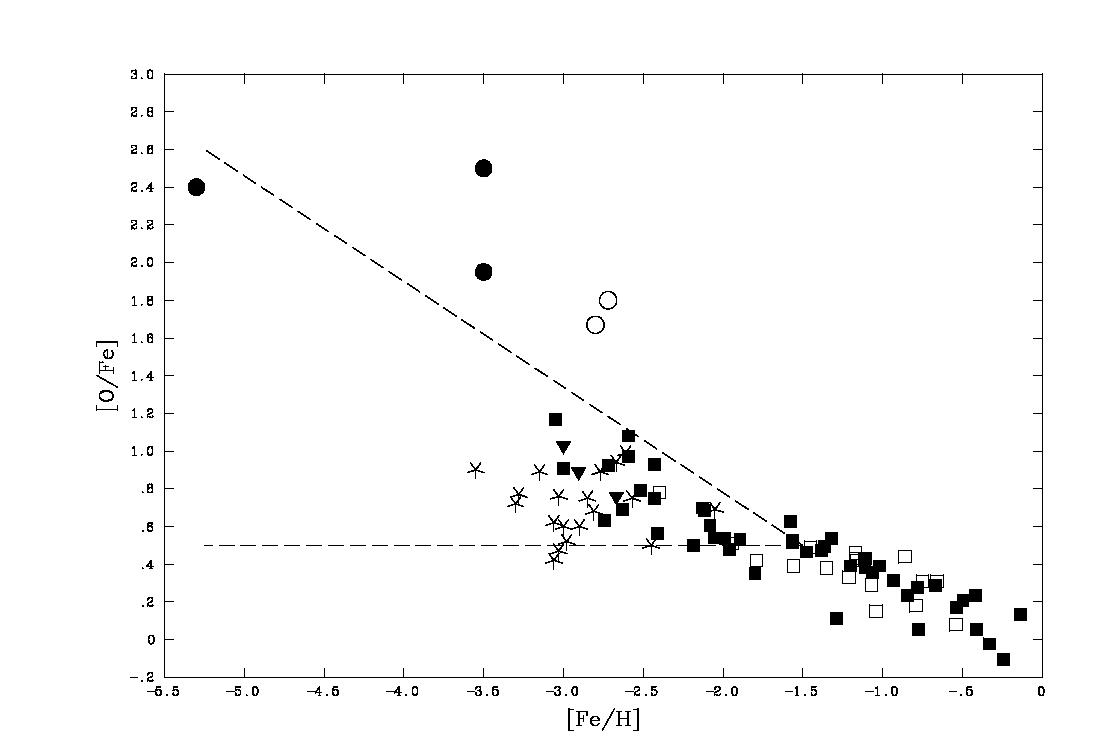
Fig.1.
Oxygen overabundance versus Fe. Data from Israelian et al. (2001),
Cayrel et al. (2003), and Nissen et al. (2002) are marked by filled squares,
stars, and open squares, respectively. Filled triangles represent the upper
limits from Israelian et al. (2001). The values were not corrected for 3D
effects because the latter do not predict consistent oxygen abundance from
different indicators. We cannot incorporate these corrections in the data
of Cayrel et al. (2003) since there are no 3D models available for giants.
Three filled circles indicate the oxygen abundance derived from the forbidden
line for the two giants discussed in this article and for HE 0107-5240 derived
from UV OH lines by Bessell et al. (2004). The spectroscopic binaries CS
29497-030 ([Fe/H] = -2.8) and LP 625-44 ([Fe/H] = -2.72) with a large enhancement
in s-process elements are indicated by empty circles and have [O/Fe] = 1.67
(Sivarani et al. 2003) and [O/Fe] = 1.8 (Aoki et al. 2002b), respectively.
Download encapsulated postcript.
|