Data Adquisition
OTELO Pseudo spectra
The TF images are combined and calibrated in wavelength and photometric flux; it requires a carefull analysis of the wavelength variation along the OSIRIS FOV of each of the images as well as the actual position of each pointing. These steps can be briefly summarized in the following figure:
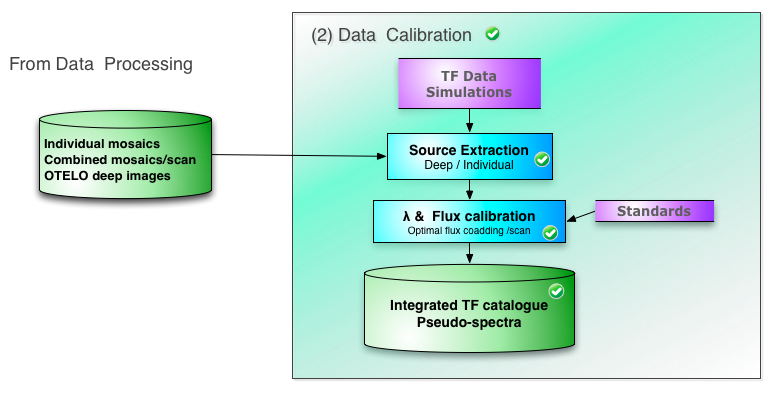
Figure: Overview of data calibration OTELO survey
The resulting OTELO pseudo spectra is a set of fluxes corresponding to different wavelength coverages, where, each flux point is the result of the combination of (in general) 6 different TF images, although this number would vary between 1 and 12 TF images.
Moreover, as result of the wavelngth variation along the FOV and the dithering process, not all pseudo spectra cover the same wavelength range. The situation is summarized in the following figure:
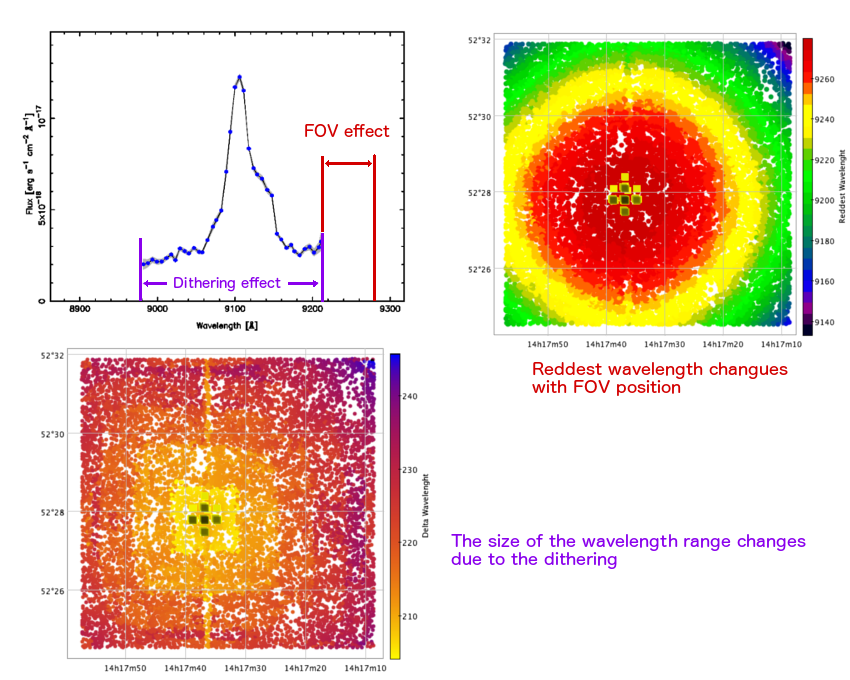
Figure: Effect of the variation of wavelength coverage in OTELO pseudo-spectra. Top-Right: Variation of the redder wavelength in each OTELO pseudo spectra, mainly driven by the wavelength variation along the OSIRIS FOV (using pointing 1 as reference value). Bottom: Spectral coverage variation ( Δλ among reddest and bluest wavelengths) of each OTELO speudo spectra along the OSIRIS FOV (using pointing 1 as reference value), mainly driven by the dithering patterm.
The net effect is that each OTELO pseudo spectra has a different wavelength coverage and resolution depending the relative position of the source with respect the FOV center of the reference image. The larger the relative distance, the bluer the redder flux point in the pseudo spectra (folowing a circular pattern), and the larger the wavelength coverage and number of fluxes points (following a rectangular pattern due to the dithering).
In addition, the effective response of each flux point, since a combination of different TF images, does not corresponds to the transmission curve of any single TF but an hybrid combination of them which depends of the relative position of the source with respect to the reference FOV center and the assumed dithering pattern. In particular, for large distances to the FOV center, the pseudo spectra would contain more than 36 wavelength points.
OTELO pseudo spectra access and description
You can access the public OTELO pseudo spectra of the individual sources from the Thumbnails page in the Data & Tools section. If you require a massive download of OTELO pseudo spectra, please contact the IP (Dr. Jordi Cepa; jcn at iac.es)
The OTELO pseudo spectra contains a header with the following information:
#OTELO-EGS-R5-( ID) X Y R.A. Dec FLAG
where ID is the OTELO ID used in the catalog; X and Y are the position in the OTELO DEEP image (see OTELO Deep & Ancillary Data for details); R.A. and DEC are the J2000.0 Equatorial coordinates in deg of the object; and FLAG is the Flags (cautions) produced by Sextractor when the particular sources are obteind from the OTELO DEEP image (see this page of Sextractor documentation for the meaning od each flag, we note that a flag equal to 0 means no caution).
There are two version of the pseudo spectra, the sort version contains 3 columns with the following information:
- mean wavelenght in the wavelenght range in Agngstroms
- flux (in 1E-17 erg/s/cm^2/A units)
- flux error (in 1E-17 erg/s/cm^2/A units)
If requested, we also provide extended pseudo spectra files with 8 columns, wich columns are:
- number of individual observations which contibutes to the flux of each wavelenght range
- lower wavelenght defining the wavelenght range
- upper wavelenght defining the wavelenght range
- mean wavelenght in the wavelenght range (column 1 in the sort version)
- deviation between mean wavelenght and the optimal wavelenght of the pseudo-spaxel
- flux (column 2 in the sort version but erg/s/cm^2/A units)
- flux error (column 3 in the sort version but erg/s/cm^2/A units)
- FWHM associated to the wavlenght range
Important Note: We recall that not all pseudo spectra contains the same number of wavelenght points, as explaind previously.
Here is an example of the pseudo spectra of the object with ID 2146 in sort (standard) format
#OTELO-EGS-R5-( 2146) 1631.537  355.932 214.2999159  52.4338312    2
#Wavelength [Angstrom]
#Flux [1E-17 erg/s/cm^2/A]
#sigma-Flux [1E-17 erg/s/cm^2/A]
9210.905     0.32550501     0.05112325
9208.202     0.29438101     0.02838626
9201.760     0.26592591     0.02073058
9196.245     0.29766127     0.01916135
9190.038     0.28629682     0.01597103
9183.527     0.25126995     0.01135204
9176.588     0.27328595     0.01257889
9172.294     0.30853588     0.01463348
9166.389     0.29136257     0.01082986
9159.508     0.33813600     0.01085160
9154.063     0.36884424     0.01279902
9147.604     0.57826625     0.01477170
9141.472     0.60835175     0.01707737
9134.882     0.67000202     0.01872577
9128.593     0.69244282     0.01567019
9123.765     0.72718477     0.01632136
9117.785     0.83449174     0.01155833
9111.004     1.15112855     0.01695031
9106.019     1.22578309     0.01810150
9099.933     1.17011627     0.01695550
9093.891     0.92575357     0.01785251
9088.534     0.70806815     0.02222698
9082.214     0.49582604     0.01285549
9075.910     0.44380371     0.01781846
9071.490     0.40738231     0.01994940
9064.440     0.33420470     0.01175732
9057.642     0.26696353     0.01005120
9053.771     0.26917626     0.01302524
9046.944     0.29095035     0.00998824
9040.423     0.26081838     0.01187246
9035.082     0.27397518     0.01323496
9028.973     0.28817939     0.01262504
9023.109     0.22478703     0.01536956
9017.767     0.25565790     0.01383688
9011.690     0.23625494     0.01279797
9005.390     0.21685379     0.01489312
8999.250     0.21610104     0.01630405
8993.427     0.22761319     0.01669720
8987.762     0.20790675     0.02117210
8981.781     0.20188732     0.03004042
And here is an example of the same pseudo spectra in the extended format
#OTELO-EGS-R5-( 2146) 1631.537  355.932 214.2999159  52.4338312    2
#Wavelength [Angstrom] (4)
#Flux [erg/s/cm^2/A] (6)
#sigma-Flux [erg/s/cm^2/A] (7)
  1 9210.905 9210.905 9210.905    3.000 0.32550501E-17 0.51123251E-18 12.35
  2 9205.499 9210.905 9208.202   -0.297 0.29438101E-17 0.28386257E-18 12.35
  3 9200.380 9203.764 9201.760    0.145 0.26592591E-17 0.20730578E-18 12.35
  5 9193.643 9198.809 9196.245   -0.339 0.29766127E-17 0.19161353E-18 12.34
  6 9188.463 9192.621 9190.038   -0.133 0.28629682E-17 0.15971034E-18 12.34
  7 9180.919 9186.813 9183.527    0.378 0.25126995E-17 0.11352044E-18 12.32
  5 9175.498 9178.456 9176.588    1.317 0.27328595E-17 0.12578888E-18 12.30
  4 9171.036 9173.904 9172.294   -0.389 0.30853588E-17 0.14633479E-18 12.28
  6 9163.860 9168.496 9166.389   -0.484 0.29136257E-17 0.10829857E-18 12.25
  8 9156.957 9162.553 9159.508    0.397 0.33813600E-17 0.10851602E-18 12.21
  5 9151.779 9156.849 9154.063   -0.158 0.36884424E-17 0.12799023E-18 12.16
  7 9145.981 9150.672 9147.604    0.301 0.57826625E-17 0.14771701E-18 12.13
  6 9139.211 9144.621 9141.472    0.433 0.60835175E-17 0.17077367E-18 12.09
  6 9133.282 9138.419 9134.882    1.023 0.67000202E-17 0.18725771E-18 12.11
  4 9127.009 9130.705 9128.593    1.312 0.69244282E-17 0.15670192E-18 12.22
  5 9122.059 9125.169 9123.765    0.140 0.72718477E-17 0.16321358E-18 12.32
  9 9114.956 9120.617 9117.785    0.120 0.83449174E-17 0.11558333E-18 12.38
  4 9109.444 9113.159 9111.004    0.901 0.11511285E-16 0.16950312E-18 12.36
  6 9103.353 9108.869 9106.019   -0.114 0.12257831E-16 0.18101500E-18 12.35
  5 9097.509 9102.124 9099.933   -0.028 0.11701163E-16 0.16955499E-18 12.34
  6 9091.003 9095.959 9093.891    0.014 0.92575357E-17 0.17852512E-18 12.34
  5 9087.286 9089.166 9088.534   -0.628 0.70806815E-17 0.22226978E-18 12.34
  7 9079.001 9084.295 9082.214   -0.309 0.49582604E-17 0.12855493E-18 12.35
  5 9073.416 9077.769 9075.910   -0.004 0.44380371E-17 0.17818461E-18 12.35
  4 9070.450 9072.817 9071.490   -1.584 0.40738231E-17 0.19949397E-18 12.36
  7 9061.107 9066.453 9064.440   -0.534 0.33420470E-17 0.11757320E-18 12.37
  7 9055.091 9060.694 9057.642    0.263 0.26696353E-17 0.10051200E-18 12.40
  4 9052.715 9054.620 9053.771   -1.866 0.26917626E-17 0.13025238E-18 12.41
  8 9043.224 9048.886 9046.944   -1.039 0.29095035E-17 0.99882398E-19 12.42
  6 9037.086 9042.400 9040.423   -0.518 0.26081838E-17 0.11872459E-18 12.43
  4 9031.154 9036.736 9035.082   -1.177 0.27397518E-17 0.13234957E-18 12.45
  6 9024.978 9030.553 9028.973   -1.068 0.28817939E-17 0.12625037E-18 12.48
  5 9022.186 9023.749 9023.109   -1.204 0.22478703E-17 0.15369562E-18 12.50
  7 9016.127 9018.818 9017.767   -1.862 0.25565790E-17 0.13836880E-18 12.50
  8 9009.930 9012.387 9011.690   -1.785 0.23625494E-17 0.12797973E-18 12.50
  6 9003.873 9006.245 9005.390   -1.485 0.21685379E-17 0.14893119E-18 12.51
  6 8997.923 9000.552 8999.250   -1.345 0.21610104E-17 0.16304047E-18 12.52
  5 8992.178 8994.306 8993.427   -1.522 0.22761319E-17 0.16697202E-18 12.52
  4 8987.408 8988.081 8987.762   -1.857 0.20790675E-17 0.21172102E-18 12.52
  2 8981.780 8981.782 8981.781   -1.876 0.20188732E-17 0.30040416E-18 12.52
#EOPs