(click figure to enlarge)
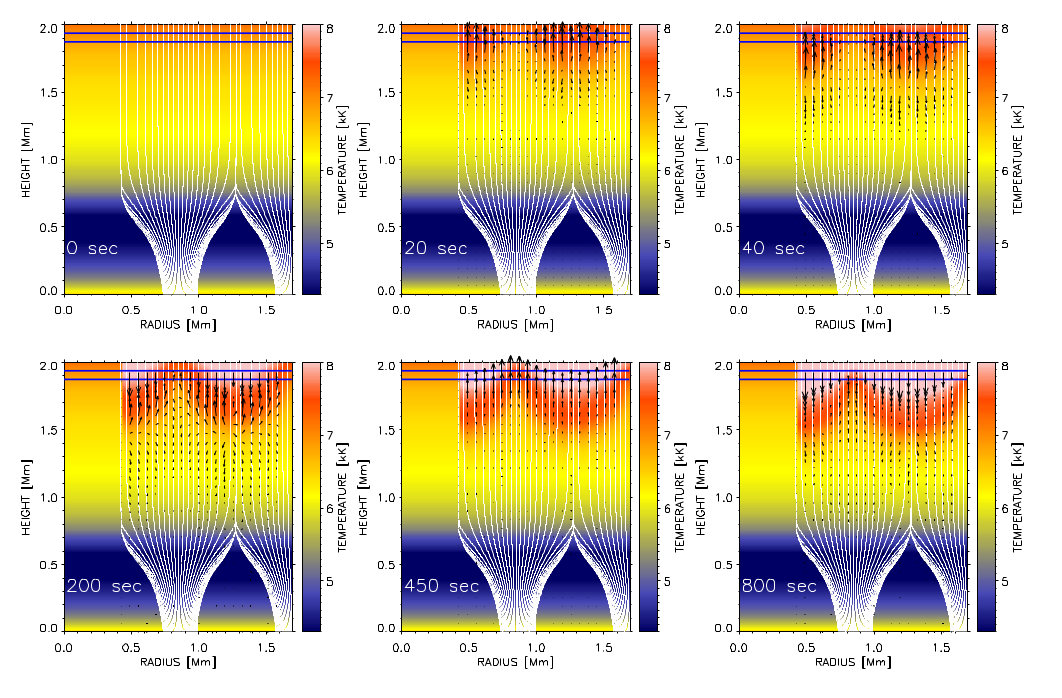
Figure 1: Time series of images from the simulation of heating of magnetized solar chromosphere. The heating is produced by current dissipation, enhanced by orders of magnitude by the presence of neutral atoms. Background color indicates the temperature in the photosphere and chromosphere, white lines are magnetic field lines, black arrows are the velocity field. Notice the temperature increase in the upper layers. From Khomenko & Collados, The Astrophysical Journal, Volume 747, Issue 2, article id. 87, 2012
(click figure to enlarge)
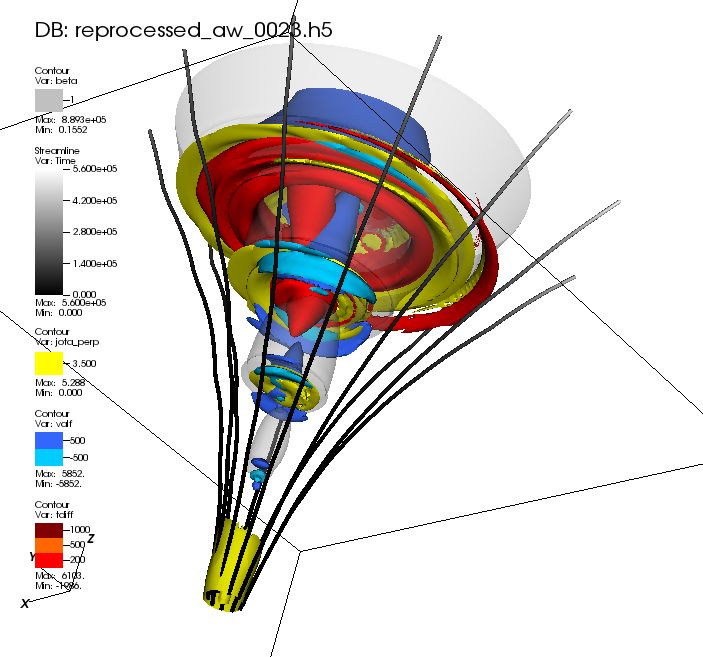
Figure 2: Three-dimensional rendering of the Alfvén wave propagation in a solar flux tube. Currents generated by wave are effectively dissipated due to the presence of neutrals, providing an order of magnitude large heating compared to dissipation of static currents (see previous result). Locations with large wave amplitude, currents, and heating are marked by blue, yellow, and red colours, correspondingly. Inclined lines are magnetic field lines. From Shelyag, Khomenko, de Vicente, Przybylski, ApJ, Volume 819, L11, 2016
(click figure to enlarge)
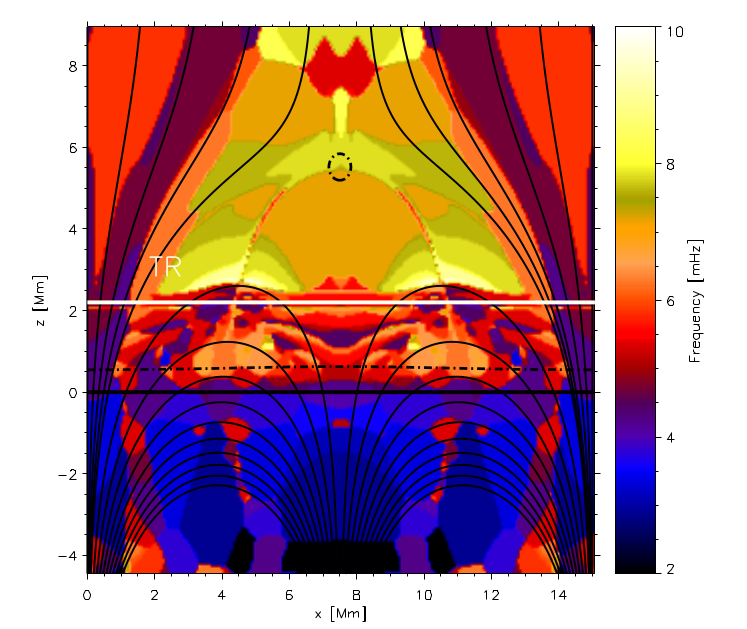
Figure 3: Simulated distribution of wave periodicities from sub-photosphere to corona in a magnetic region containing a system of arches, vertical flux tubes and a magnetic null-points. This results aims at explaining periods of waves observed in solar quiet regions, depending on magnetic field topology. From Santamaria, Khomenko, Collados, Astronomy & Astrophysics, Volume 577, A70, 2015.
(click figure to enlarge)
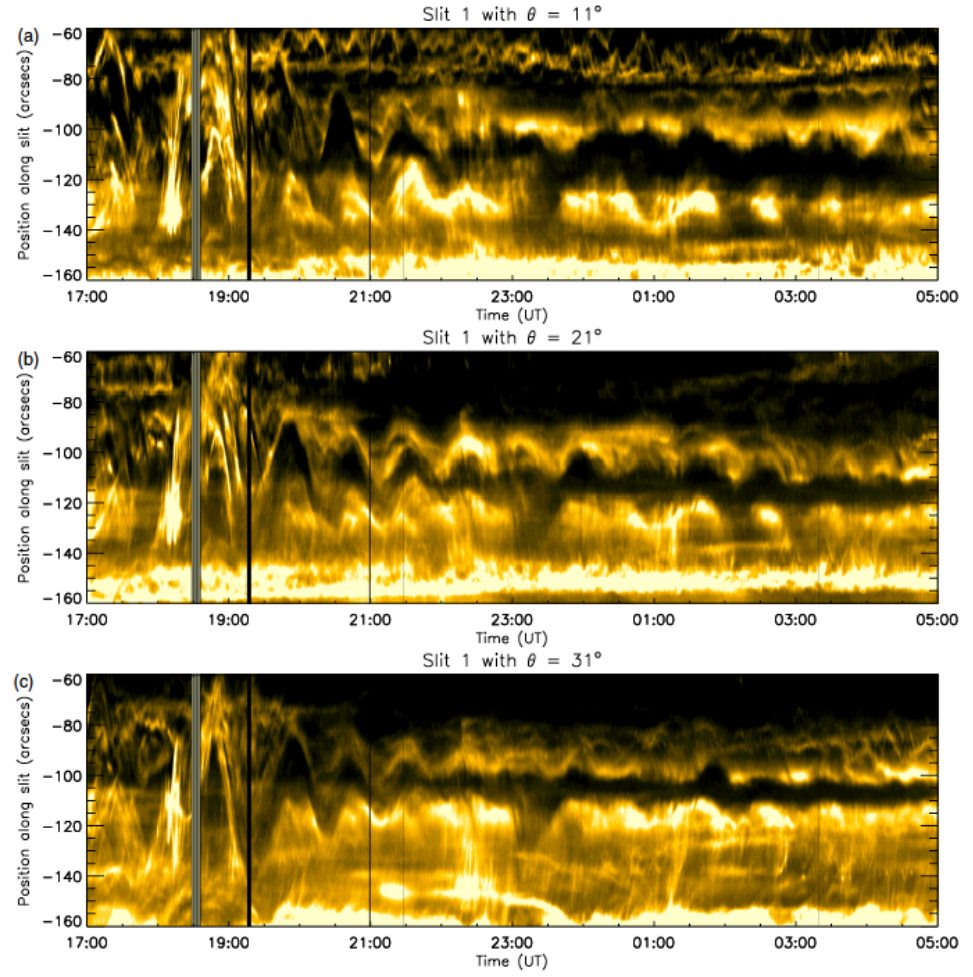
Figure 4: Time-distance diagrams showing large-amplitude oscillations in a solar prominence detected by SDO/AIA instrument. Large-amplitude oscillations are frequently triggered in solar prominences triggered by closer flares. Colors indicate brightness of solar surfaces in the AIA filter, darker areas are due to the presence of prominence's cooler plasma. Notice the sinusoidal shapes of the oscillations, decaying in time. From Luna et al., The Astrophysical Journal, Volume 785, 79, 2014
(click figure to enlarge)
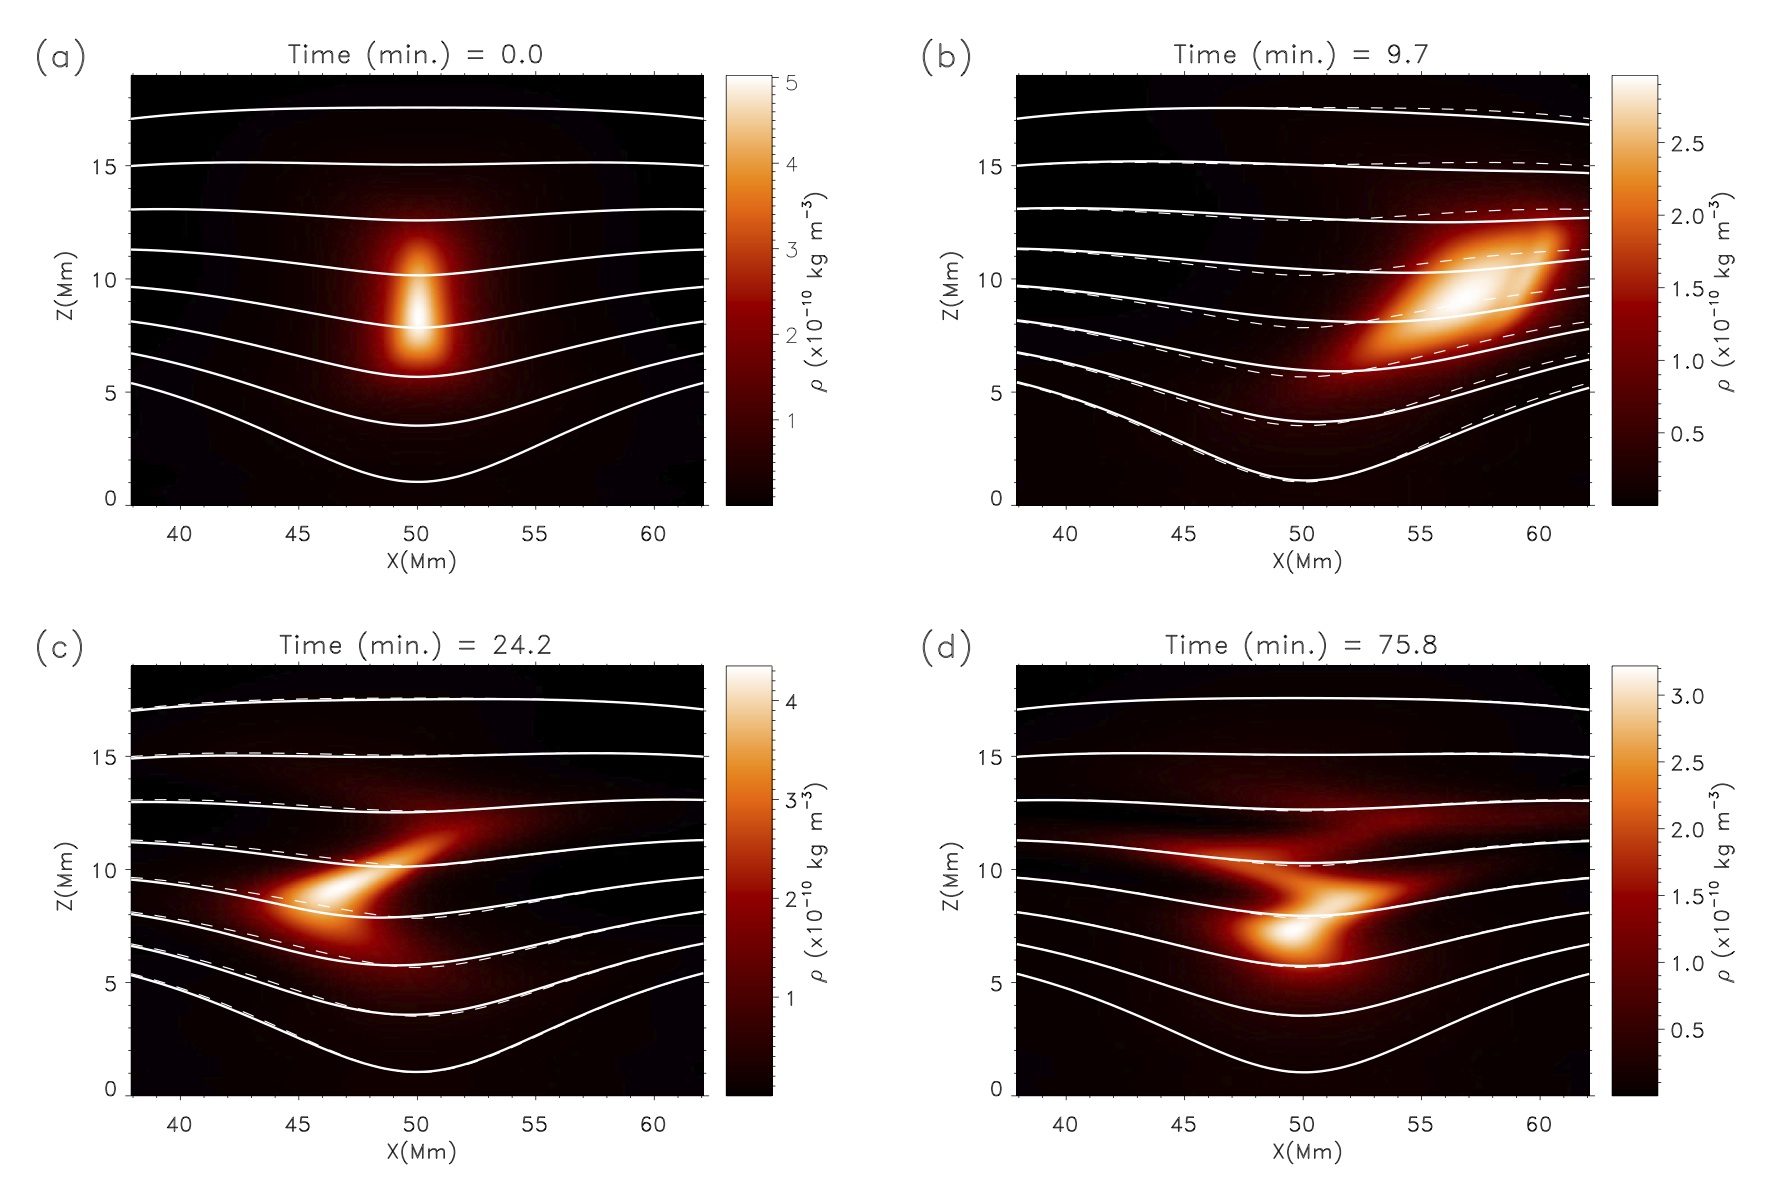
Figure 5: Snapshots of the simulations of large-amplitude longitudinal oscillations of prominences with Mancha code. The time is indicated at each panel. Regions with lighter colors have larger density of the prominence plasma. While lines are magnetic field lines. This work proofs gravitational pendulum model to explain large-amplitude prominence oscillations. From Luna, Terradas, Khomenko, Collados, de Vicente, ApJ, Volume 817, 157, 2016
(click figure to enlarge)
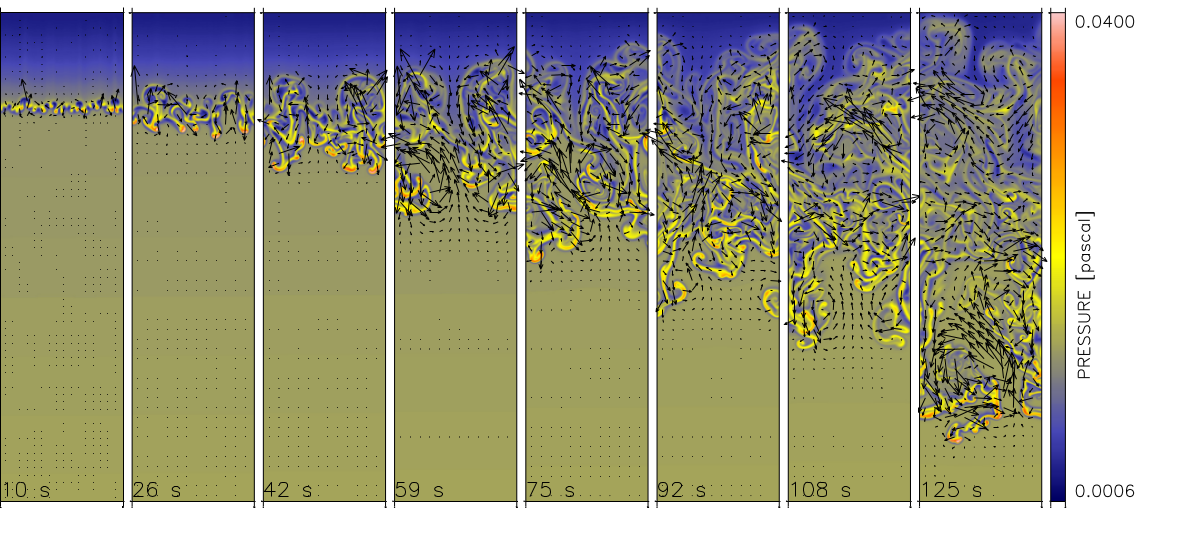
Figure 6: Numerically simulated Rayleigh-Taylor instability in a partially ionized solar prominence. Colors indicate pressure distribution, arrows are the velocity field. The presence of neutrals makes prominences always unstable at small scales. From Khomenko, Díaz, de Vicente Collados & Luna, Astronomy and Astrophysics Volume 565, id.A45., 2014
(click figure to enlarge)
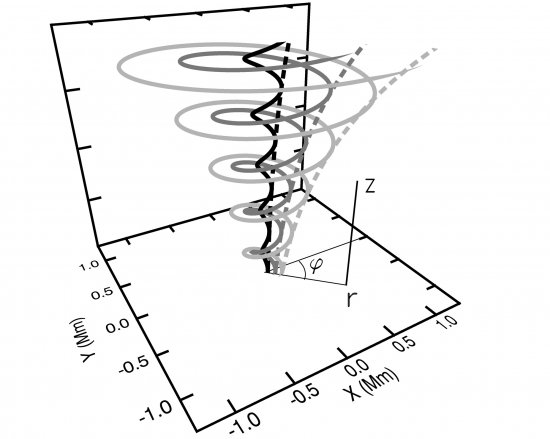
Figure 7: Three-dimensional rendering of the magnetic field geometry of prominence barbs proposed to explain the apparent rotating motions suggestive of a tornado-like structure, detected in recent high-resolution and high-cadence observations. From Luna, Moreno-Insertis \& Priest, ApJ, Volume 808, L23, 2015
(click figure to enlarge)
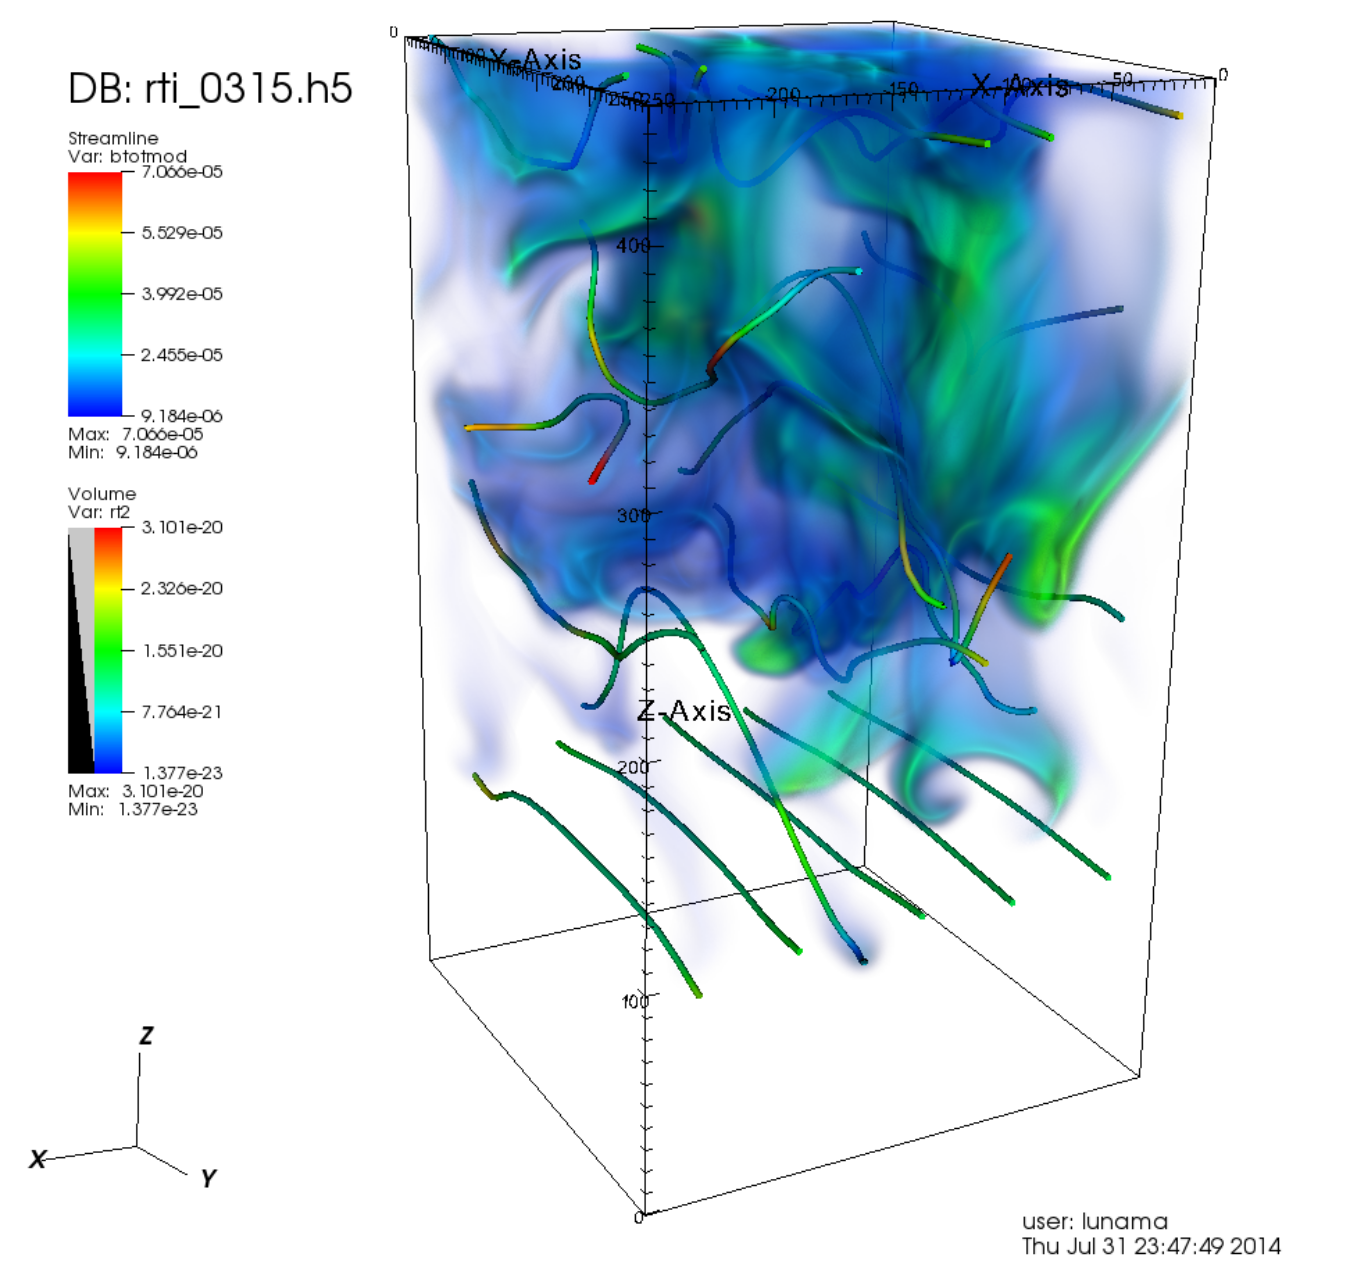
Figure 8: Three-dimensional simulations of the Rayleigh-Taylor instability at the border of solar prominence and corona. Colors indicate density of the plasma, colored lines are magnetic field lines.

(click figure to enlarge)
Figure 9: Snapshot from simulation of a Rayleigh-Taylor instability using Mancha code and Adaptive Mesh Refinement (AMR). Colors indicate density of the plasma. AMR is a method for dynamically (de)refining the grid resolution, allowing simulations with large length and time-scales.
(click figure to enlarge)
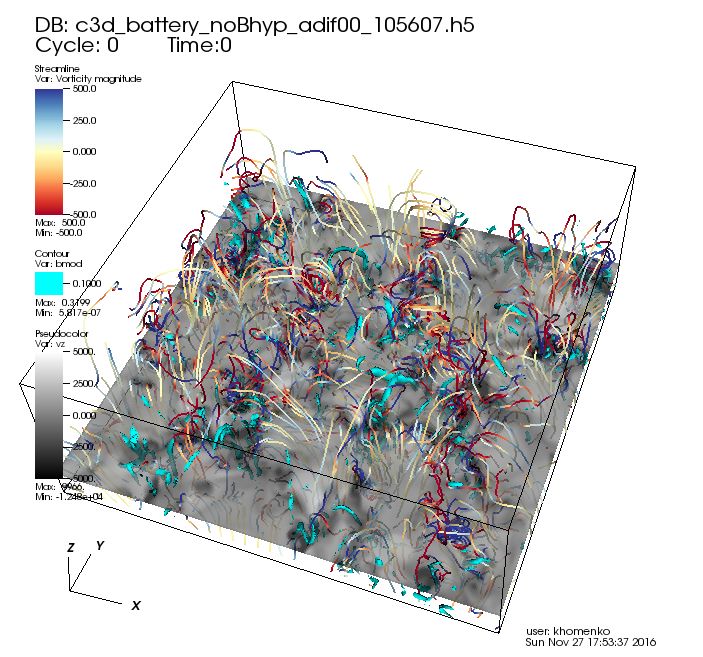
Figure 10: Snapshot of the simulated solar magneto-convection by Mancha code from Khomenko, Vitas et al. 2017 (submitted to Astronomy \& Astrophysics). Grey image shows vertical velocity, colored lines are velocity streamlines, blue surfaces are locations with enhanced magnetic field generated by the battery effect and amplified by local solar dynamo.
(click figure to enlarge)
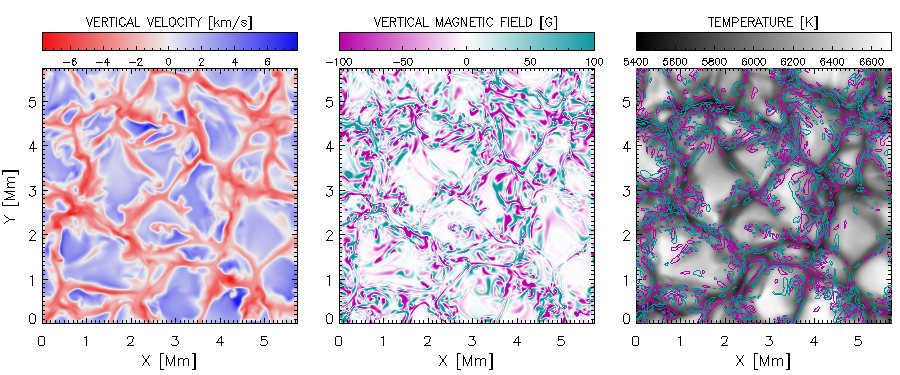
Figure 11: Snapshots of solar magneto-convection by Mancha code, showing vertical velocity, vertical magnetic field and temperature at the surface. The contours over the temperature image indicate locations of mixed-polarity magnetic field generated via battery effect and amplified by local dynamo. From Khomenko, Vitas et al. 2017 (submitted to Astronomy & Astrophysics).